Intel Trace Analyzer and Collector (ITAC) - Tracing#
Intel Trace Analyzer and Collector (ITAC) allows tracing and visualization of the communication behavior of an MPI application. ITAC consist of two components:
- Intel Trace Collector collects and analyzes MPI and non-MPI applications.
The result is written to an
.stftrace file. - Intel Trace Analyzer is a GUI application to visualize traces and analyze
.stftrace files.
Requirements for using Intel Trace Collector#
- The application must be compiled with Intel compiler. However, other compilers might work too.
- The application must use Intel MPI. Other MPICH-based/-compatible MPI libraries might work too, by specifying
LD_PRELOAD=...libVT*.so:...libmpi.so.libVT.so: tracing of MPI applicationslibVTfs.so: tracing of fail-safe MPI applicationslibVTim.so: tracing of load imbalancelibVTcs.so: tracing of distributed non-MPI applicationsVT_sample.so: counter tracing with PAPI
- The ITAC module must be loaded via
module load itac.
Creating a trace file#
In this example we analyze and trace the bt benchmark with class size S from the NAS Parallel Benchmarks (NPB) on a cluster node.
The following code shows the steps to download and build the benchmark as well as analyzing it with ITAC.
All commands are executed on a cluster node. The -trace flag specified for mpirun starts the MPI application with Intel Trace Collector activated.
# ensure compute node can access the Internet
export https_proxy=http://proxy.nhr.fau.de:80
export http_proxy=http://proxy.nhr.fau.de:80
# download NAS parallel
wget https://www.nas.nasa.gov/assets/npb/NPB3.4.2.tar.gz
# unpack and change into the MPI directory
tar xzf NPB3.4.2.tar.gz
cd NPB3.4.2/NPB3.4-MPI

# load Intel compiler, Intel MPI, ITAC
module load intel intelmpi itac

# build benchmark with Intel compilers
make bt MPIFC=mpiifort MPIC=mpiicc CLASS=S

# use -trace flag to analyze benchmark with ITAC
mpirun -trace -n 4 bin/bt.S.x

# output:
#
#  NAS Parallel Benchmarks 3.4 -- BT Benchmark
# ...
#
# [0] Intel(R) Trace Collector INFO: Writing tracefile bt.S.x.stf in /home/.../NPB3.4.2/NPB3.4-MPI
At the end of the execution Intel Trace Collector writes the results into an .stf file, prefixed with the name of application binary.
Viewing a trace file#
The trace file (<application-name>.stf) is visualized with Intel Trace Analyzer traceanalyzer. In this example, we will run traceanalyzer on the cluster frontend and use X forwarding to display the GUI locally.
Note
This requires an X server on the client. The easiest way is to perform the following steps when you
are connected via XRDP on the dialog server csnhr.nhr.fau.de.
Note
We assume you have already configured your SSH found under SSH Command line.
To enable X forwarding for an SSH connection the -X flag must be specified when connecting to the cluster frontend, like:
On the frontend we load the ITAC module and run traceanalyzer by specifying the path to the previously generated trace file bt.S.x.stf.
If everything was setup correctly the Intel Trace Analyzer window should now open. A high level overview shows which amount of time was spent in MPI calls and how much time was spent in user code of the application.
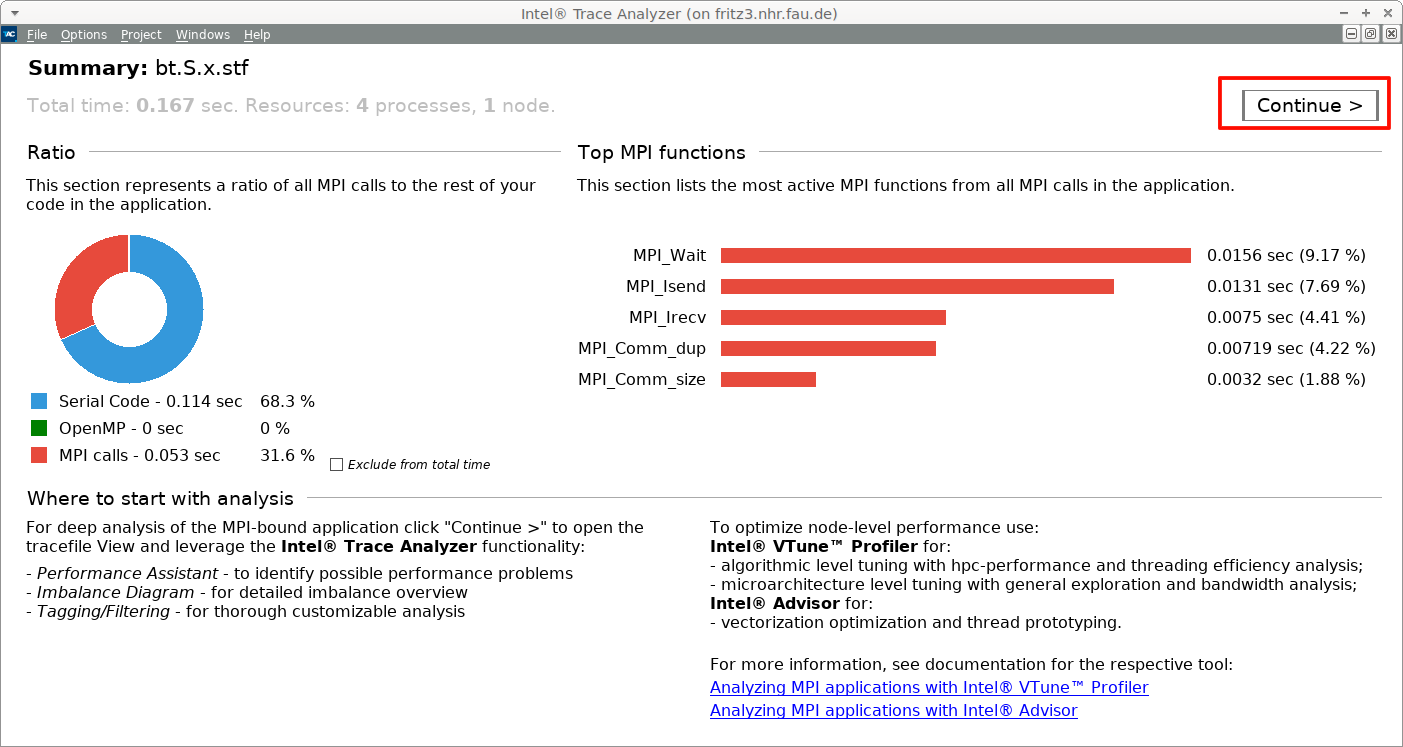
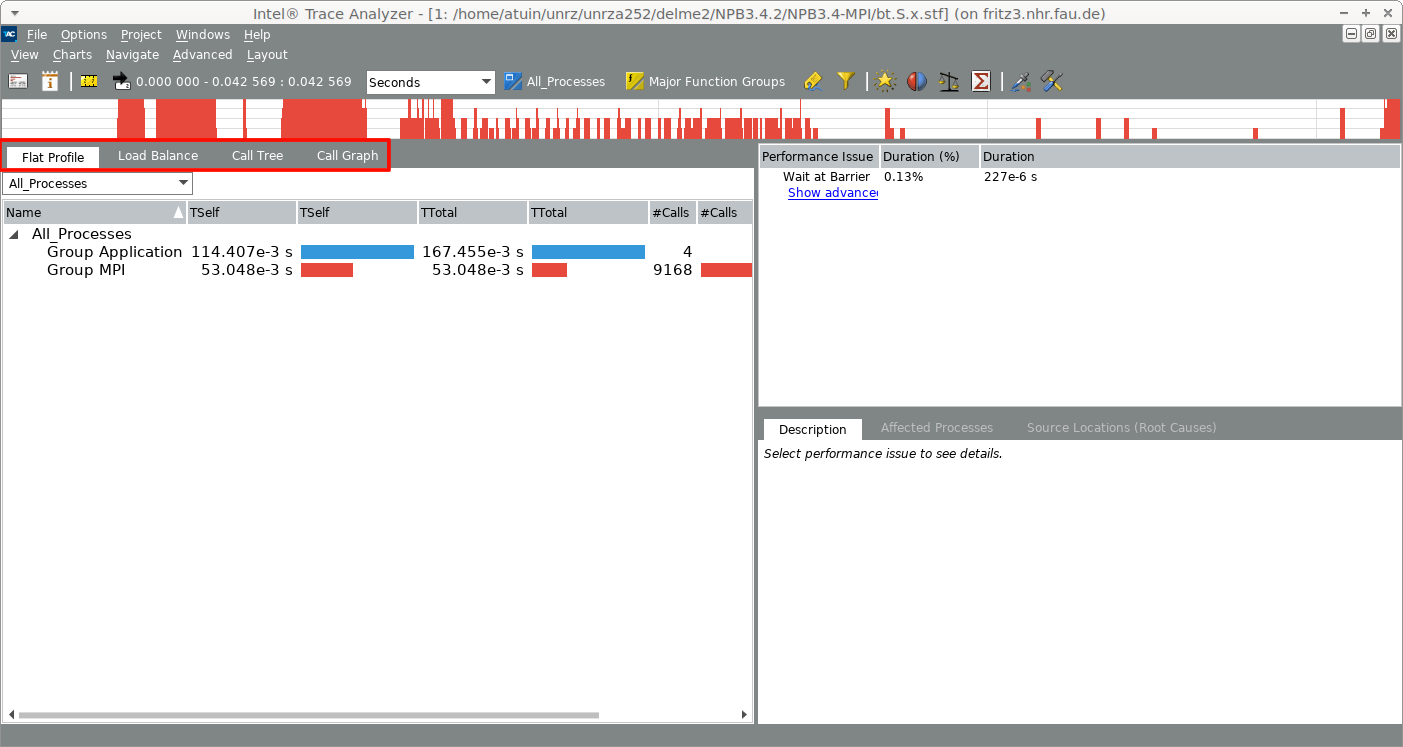
Click the Continue button to go see a flat profile. You can change the view by clicking on another tab (marked by the red box).
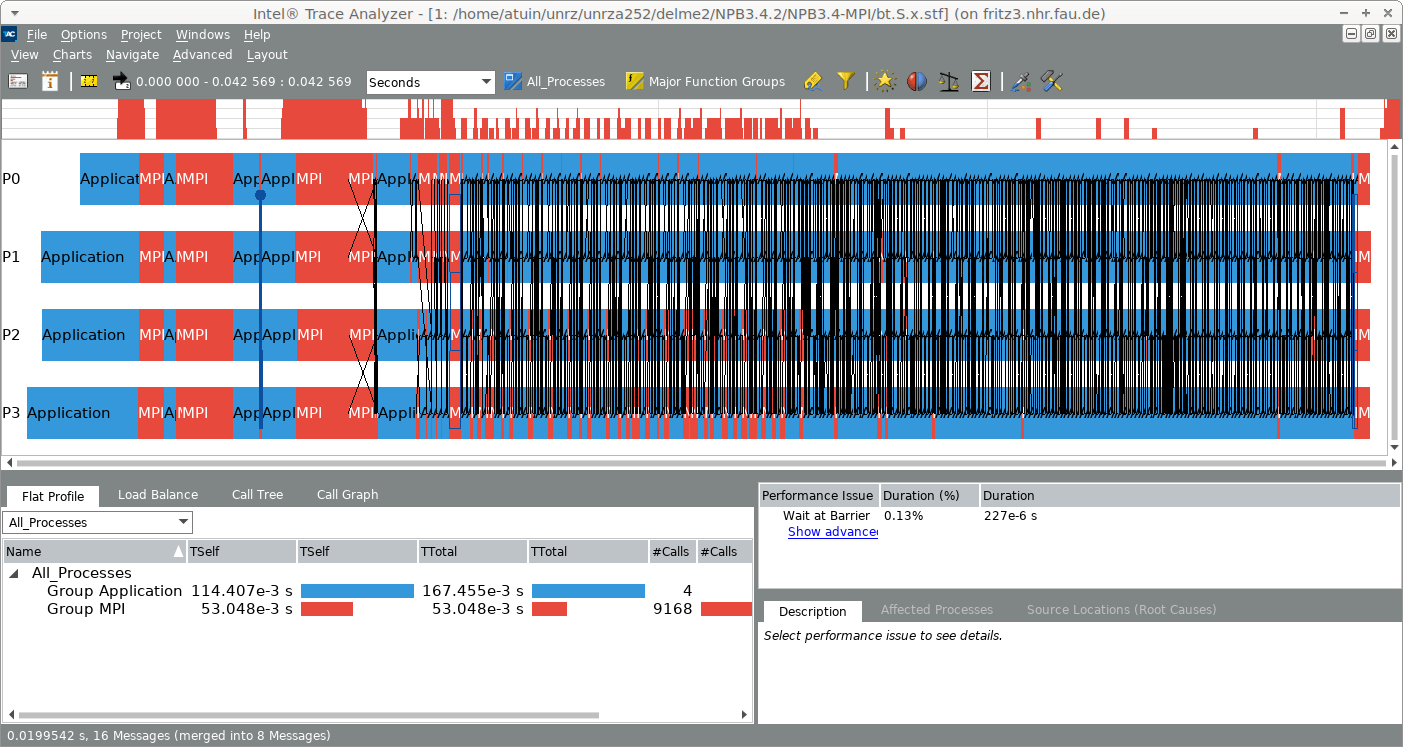
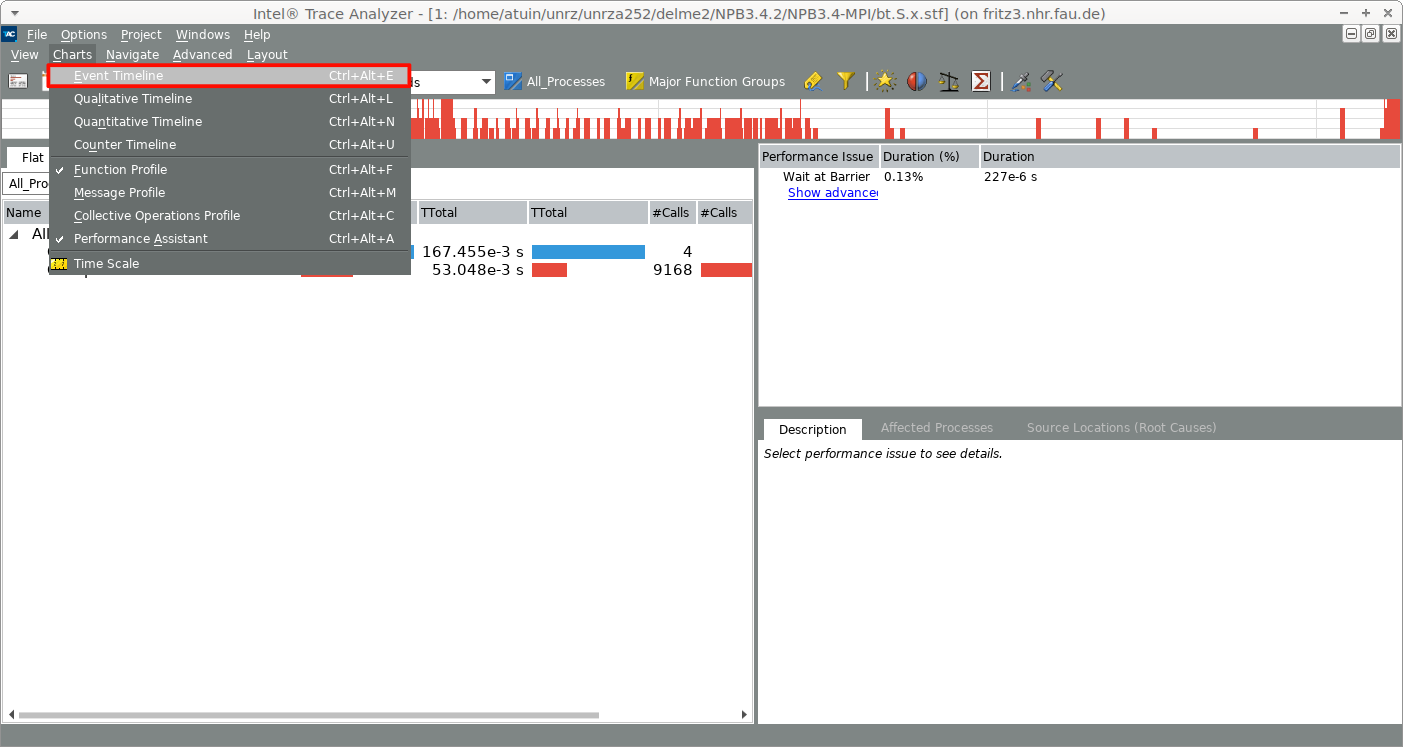
To see the Event Timeline click in the lower menu bar on Charts and Event Timeline or press Ctrl + Alt + E:
The Event Timeline shows user code and time spent in MPI calls for all processes resolved over time. Additionally communication between processes is indicated by black lines.