Job monitoring with ClusterCockpit#
Introduction#
Monitoring the performance of your running jobs is important to identify faulty jobs or jobs with a large optimization potential. NHR@FAU provides ClusterCockpit, a powerful web-interface for job-specific performance monitoring. ClusterCockpit gives HPC users access to hardware performance counter metrics for all of their jobs. This includes flop rates, main memory bandwidth, SIMD vectorization ratios, allocated memory capacity, as well as network and file IO metrics. ClusterCockpit provides a powerful filter and sorting interface to search and explore jobs. Apart from performance and resource utilization metrics ClusterCockpit also provides basic job statistic overviews. Project managers are also able to see jobs from other users belonging to the same project.
ClusterCockpit is an Open-Source project led by NHR@FAU and hosted at GitHub.com.
Usage#
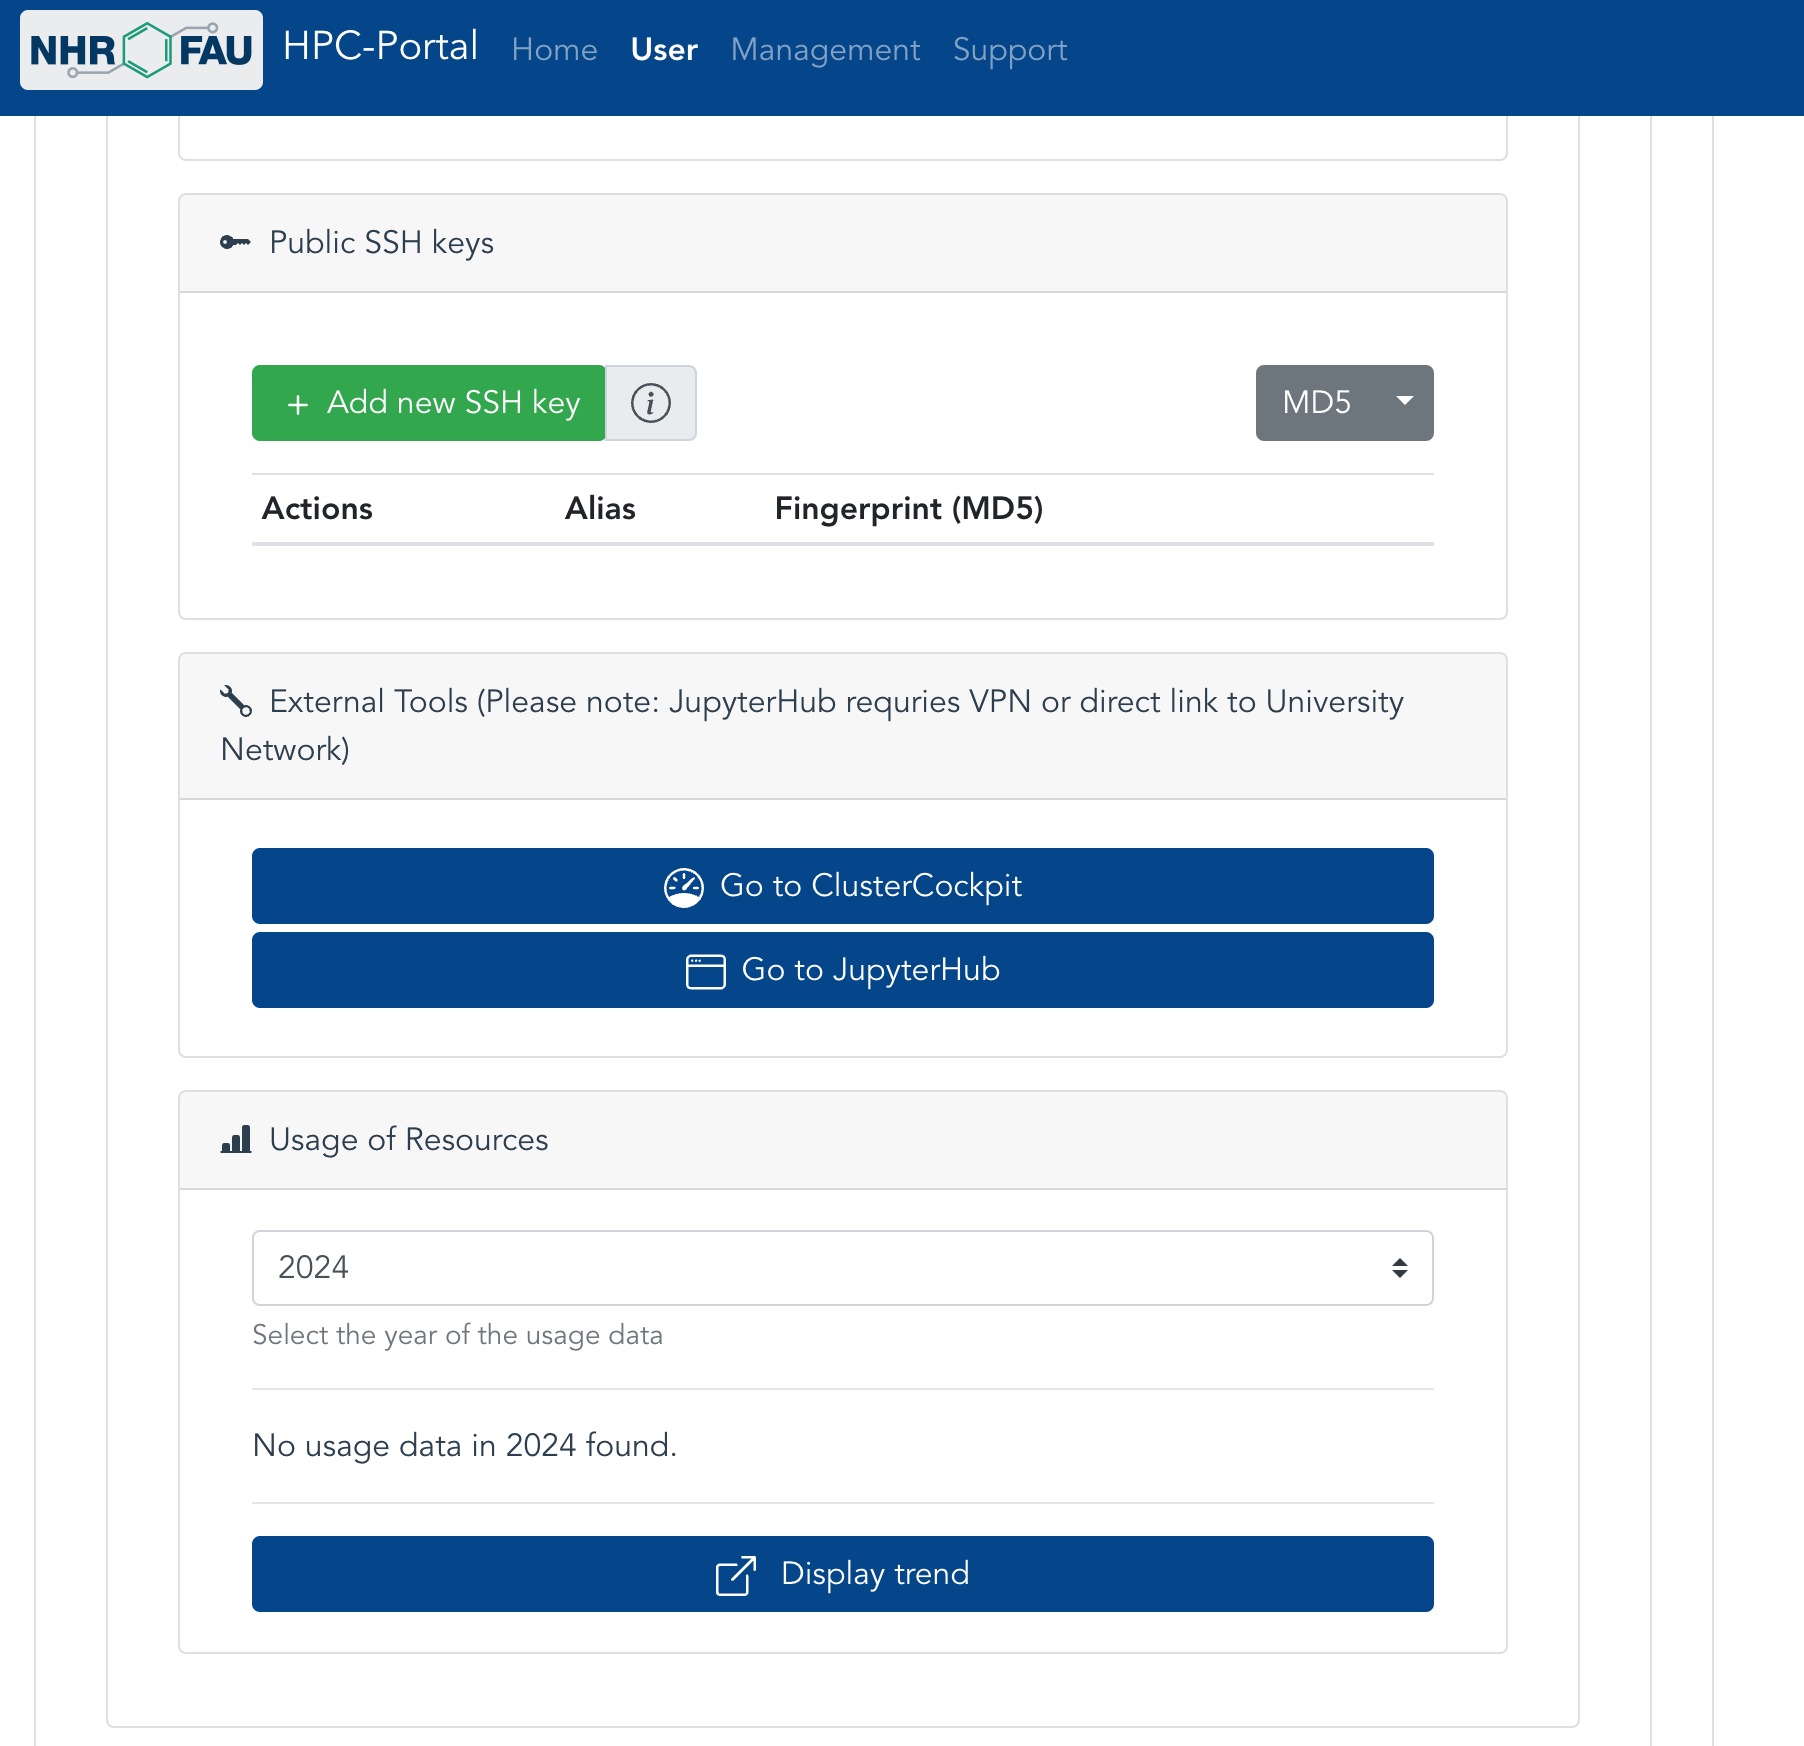
ClusterCockpit is only accessible from within an authenticated HPC Portal session.
Click on the user tab and unfold the desired account.
To access ClusterCockpit, click on the button Go to ClusterCockpit
Basic user interface#
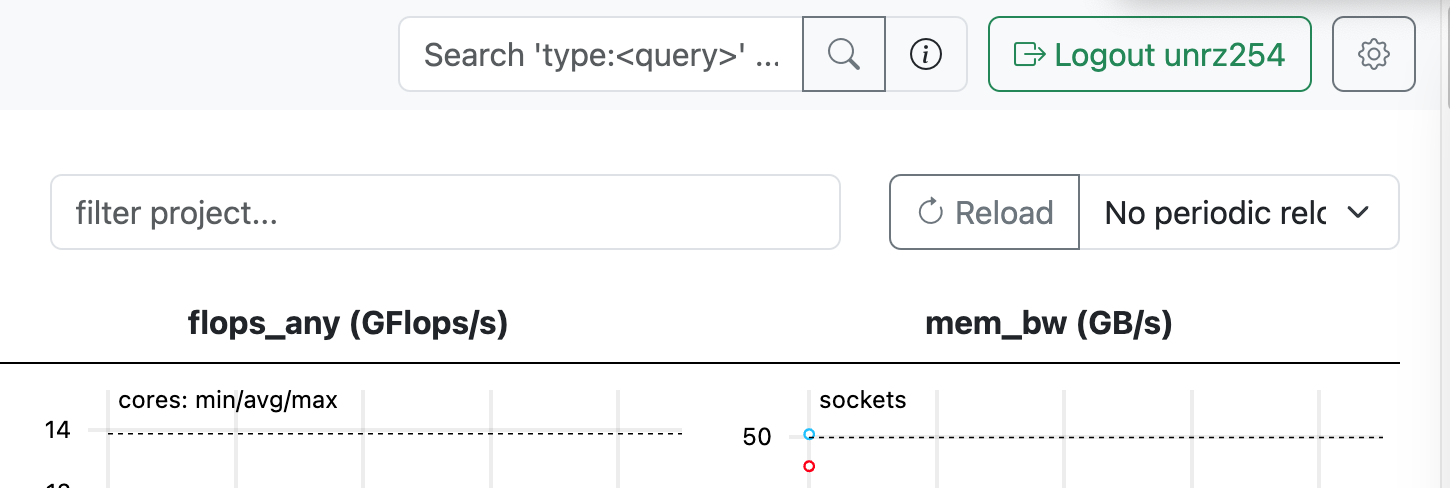
The navigation bar at the top provides a universal search where you can search for specific job ids, job names, and array job ids.
Please hover the mouse on the information field at the right side of the search field to get details on the input syntax.
The rightmost button provides a basic configuration of layout and plots.
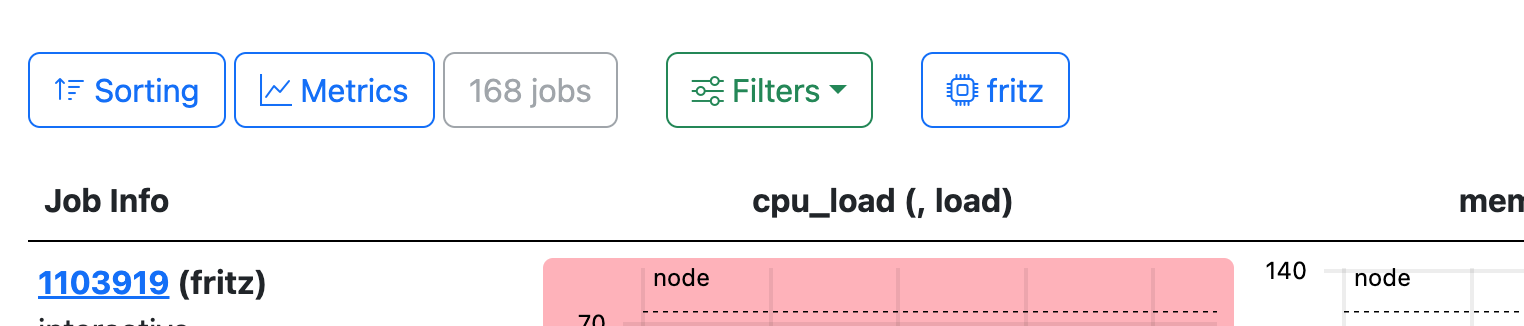
All job lists provide the same user interface for job sorting and filtering.
The filters provide a powerful way to search and analyze jobs.
There is also the option to configure which metrics are shown, this information is persisted on a per user and view base.
Available views#
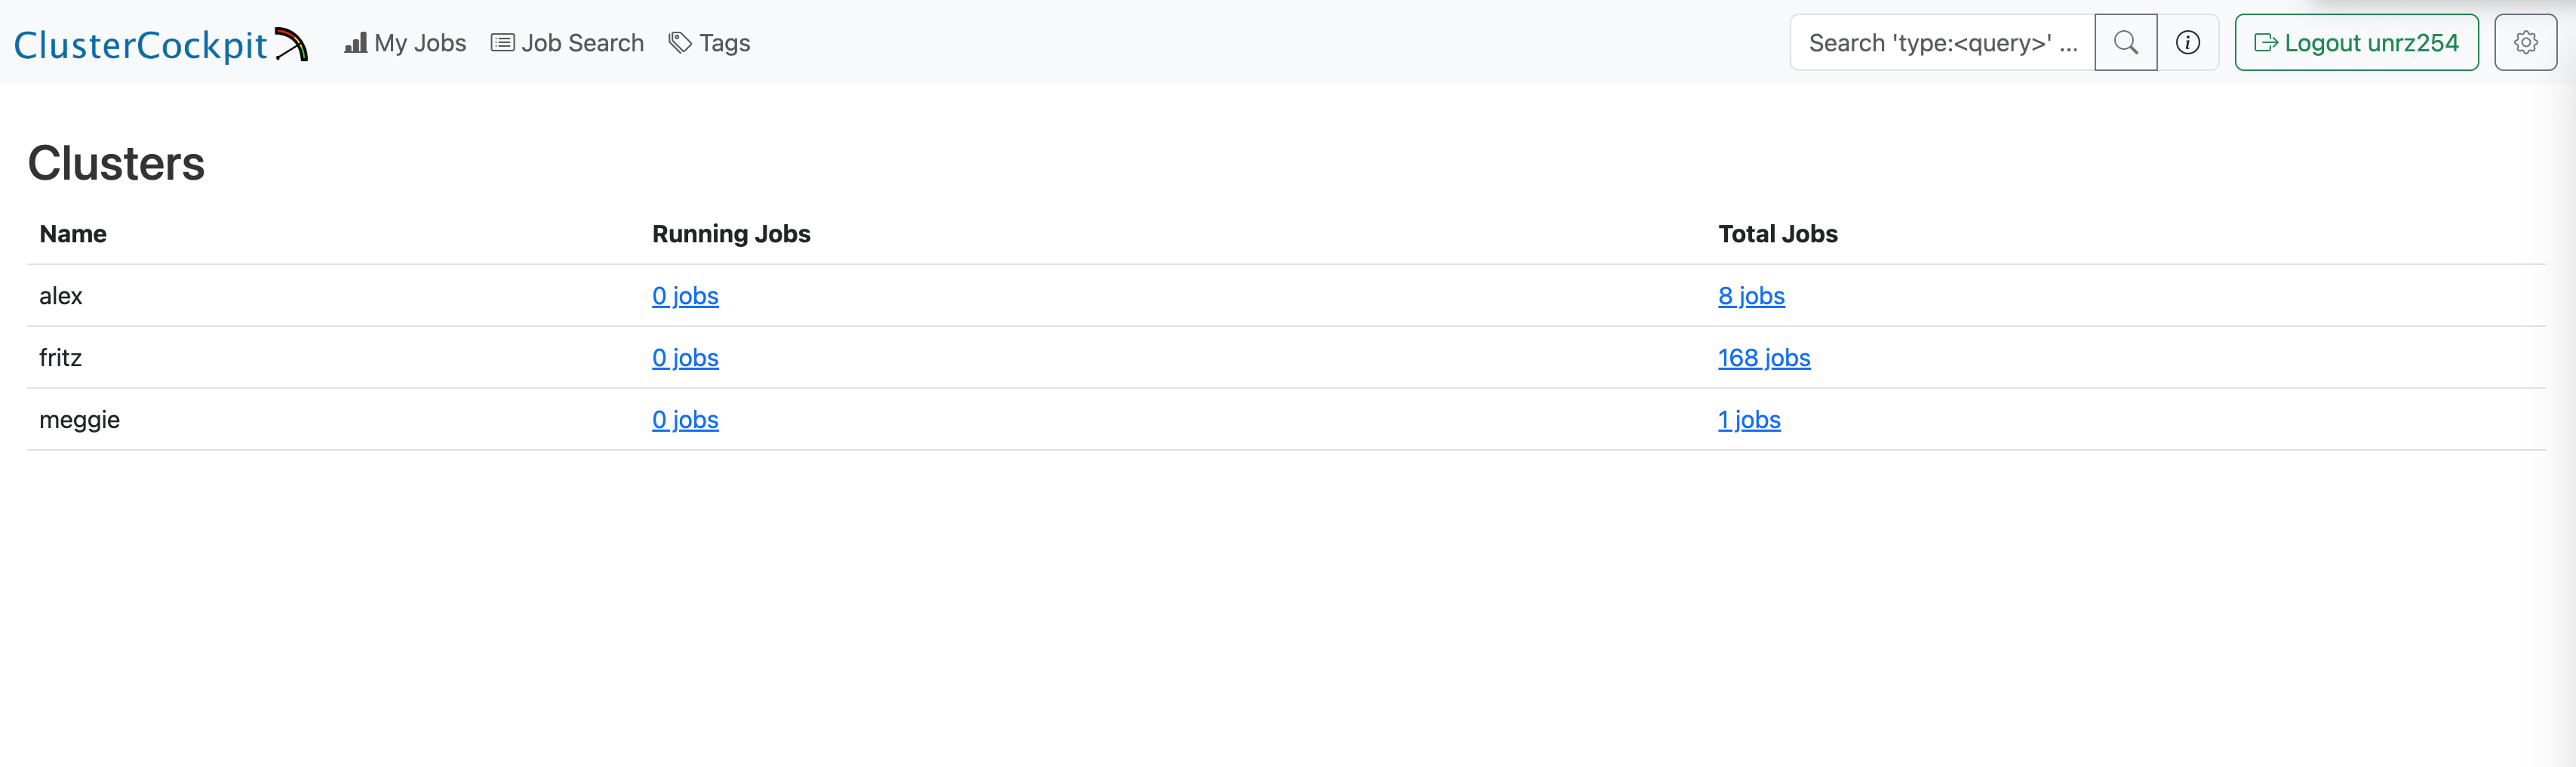
Landing page#
The landing page shows a list of all clusters where user jobs were running.
Direct links are available for job lists of either running or all jobs on specific clusters.
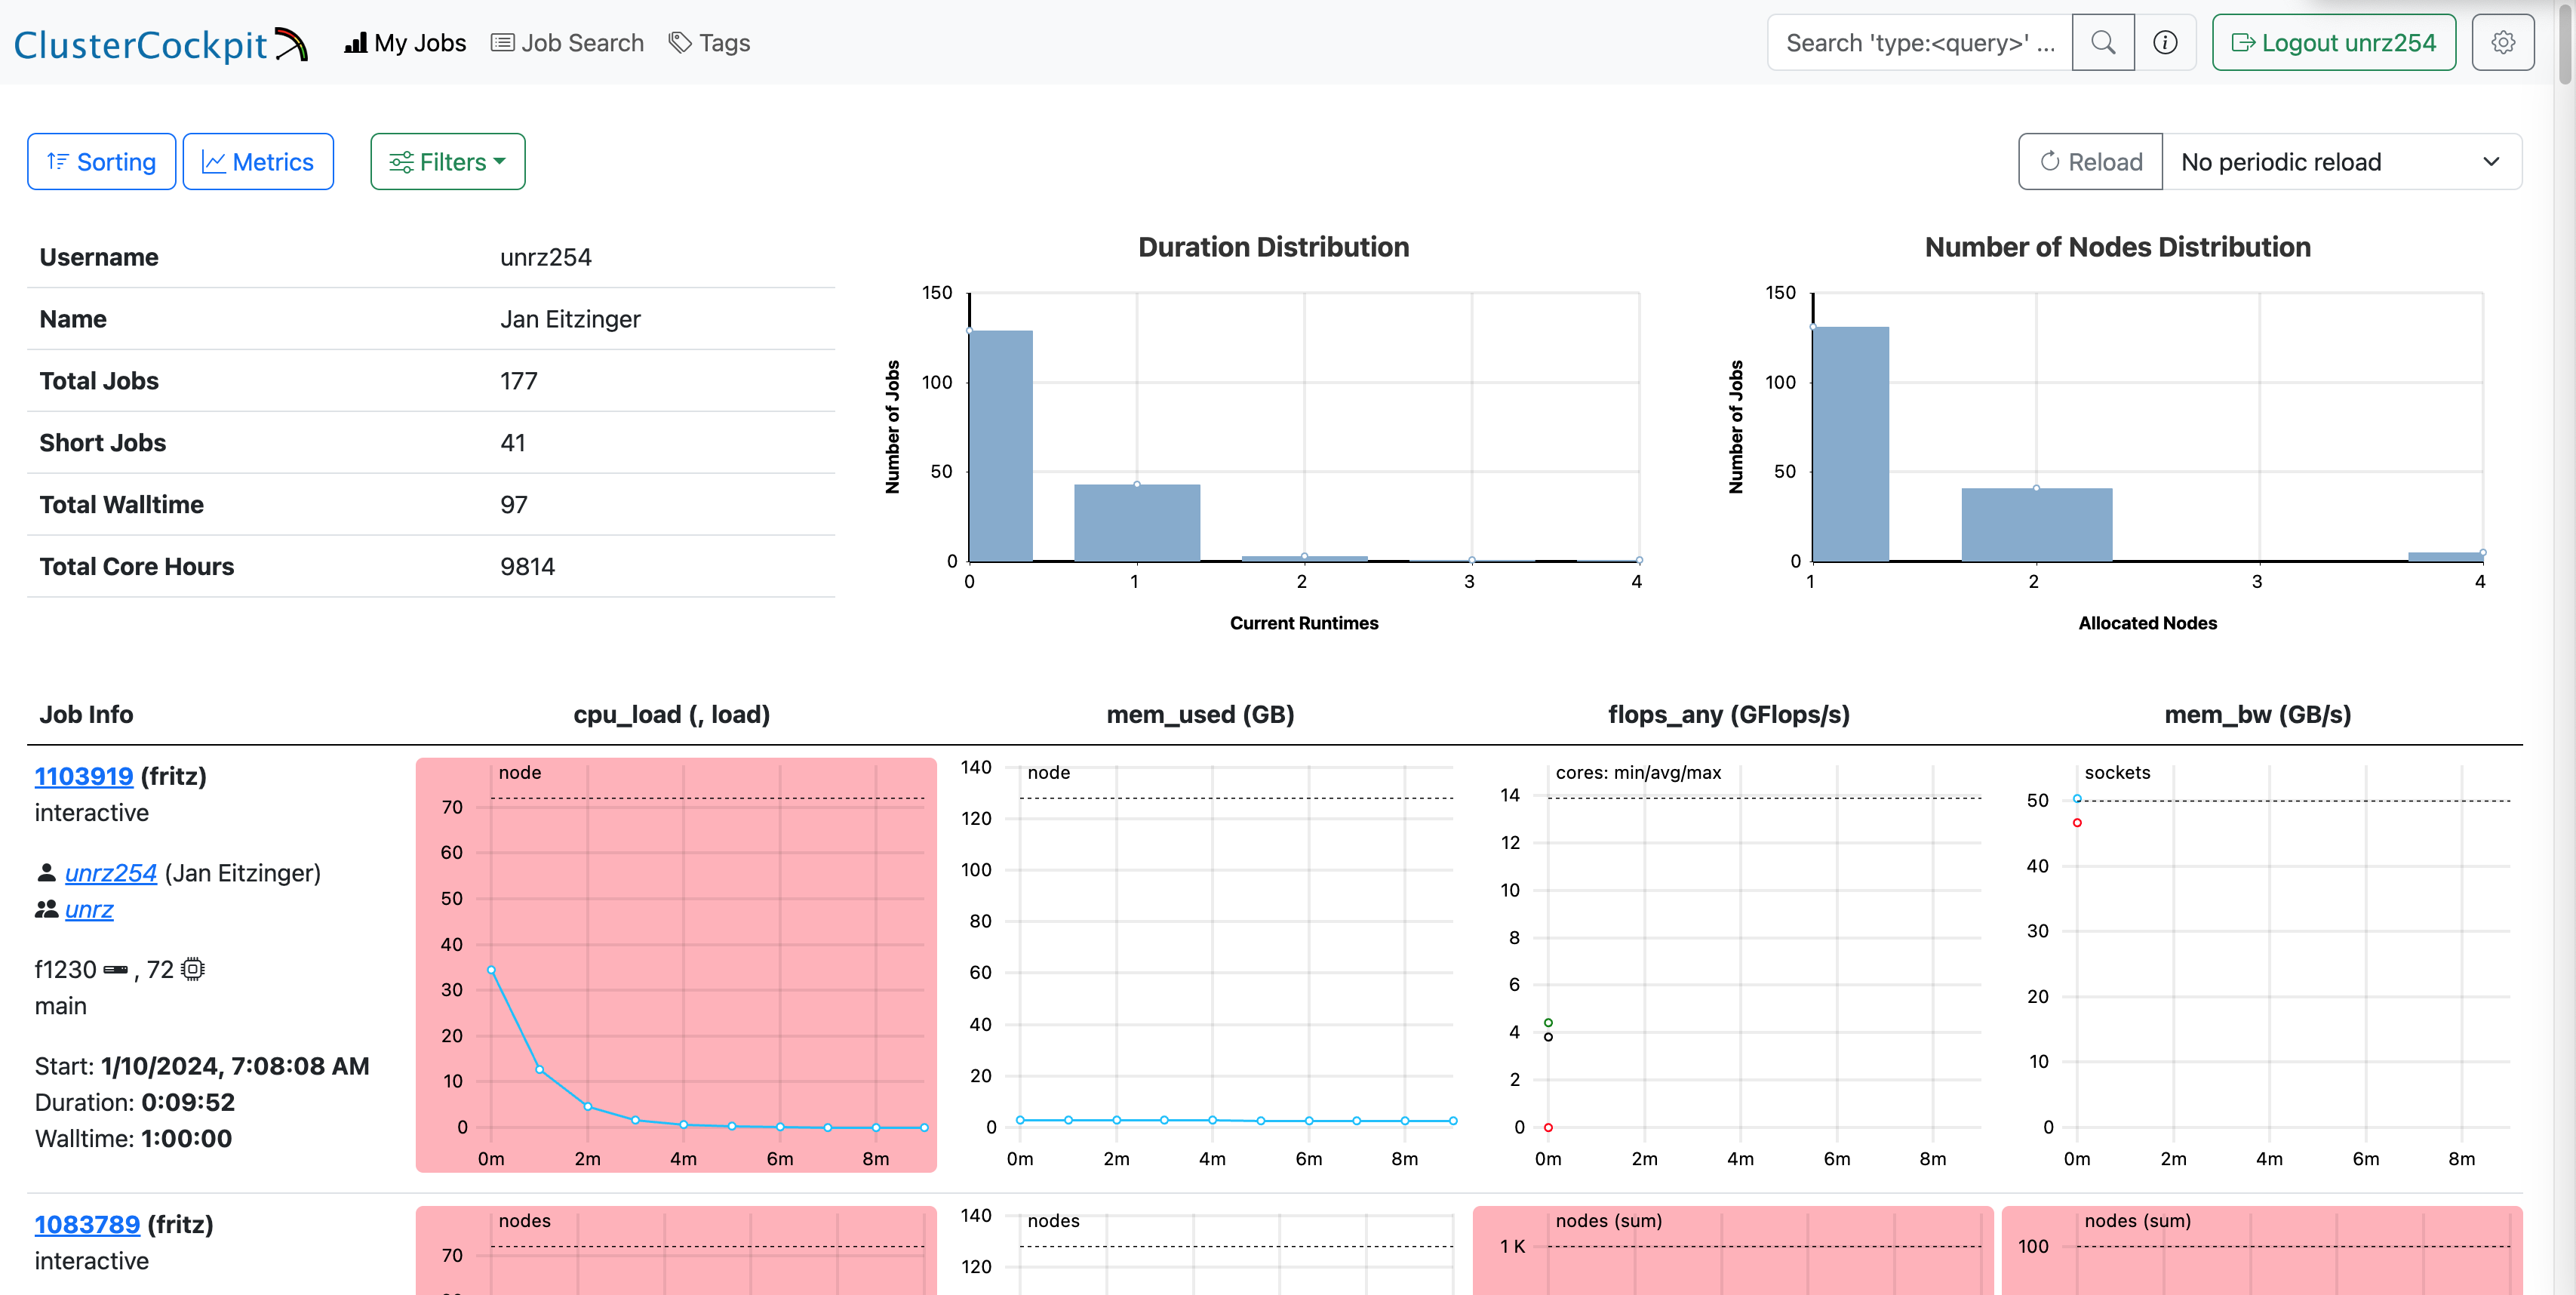
My Jobs#
At the top of this view you get an basic job statistic overview for the current job list.
This includes aggregated job counts, and job duration and nodes used histograms.
This statistic is updated for changed filter settings.
The job list contains all user jobs with the job meta information on the left
and a limited set of plots that give a first overview of the jobs resource utilization.
All plots contain a dashed black reference line for typical metric values.
If the metric job average for the current metric is below certain thresholds the plot background is tinted red or orange.
If one or more plots are tinted red this indicates that a job does not use any resources.
If you click on the job id on the left, a job-specific view with more information and plots is shown. It takes a few minutes after job start before it is shown in the list of running jobs.
Tag view#
Users can enrich the information of a job with tags, a key/value pair, describing the job. In the tag section, you can select tags and get a list of all jobs with the requested tags.
Reporting problems#
Please contact the common support hpc-support@fau.de if you have problems with the ClusterCockpit service at NHR@FAU.