ARM DDT#
ARM DDT is a parallel debugger. NHR@FAU holds a license for 32 processes.
You can use it to debug serial programs and parallel code that uses MPI and/or OpenMP. It supports single stepping, into, out of, over functions, inspecting variables, watchpoints, tracepoints, etc. You can use it for C, C++, or Fortran code.
DDT is installed on the main production systems. In order to use it, load
the module via module load ddt. This should give you the latest
installed version of the tool.
You can watch a video on handling DDT here: HPC Cafe: Using the Arm DDT debugger (Note that this demo assumes that you can start DDT from within a batch job, which is not possible with SLURM. See below for details.)
Debugging on a cluster frontend#
You can use DDT interactively on the frontends to debug serial or
OpenMP-parallel code. If a.out is your binary, just start it with:
Debugging a batch job#

With
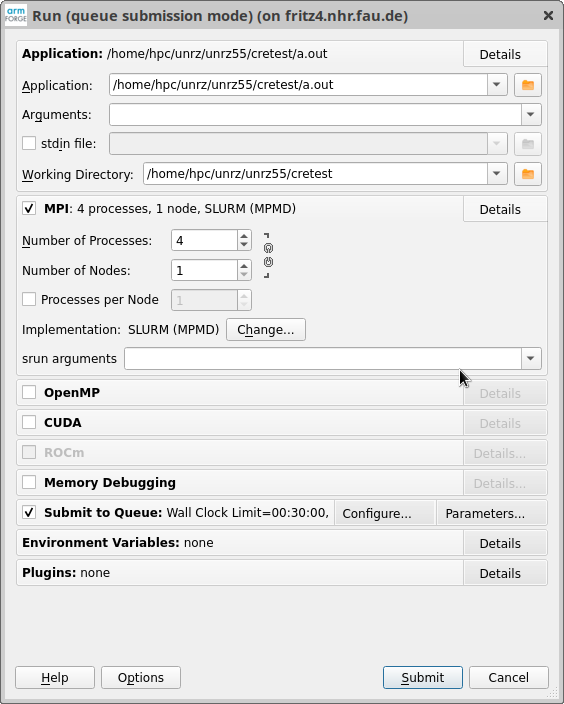
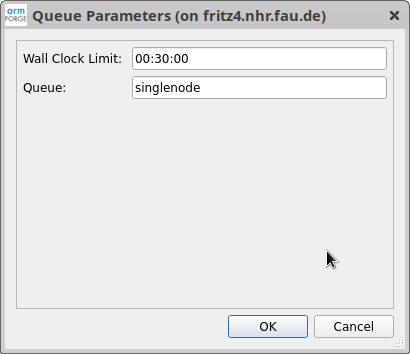
you start DDT without any connection to a binary (yet). The standard dialog box pops up. For an MPI job, select "MPI" and the number of processes. For "Implementation," the choice "SLURM (MPMD)" is usually correct but depending on your MPI implementation and the scheduler setup, other settings may be required. Further down, select "Submit to Queue." With "Parameters..." you can set the job runtime and the partition it will use. Note that you must specify a partition.
After clicking on "Submit," DDT submits a batch job and attaches to it.
Documentation and contact#
Please see the official DDT documentation for comprehensive information: Arm Forge User Guide: DDT. In case of problems with the specific setup at NHR@FAU, contact HPC support.